Where people live
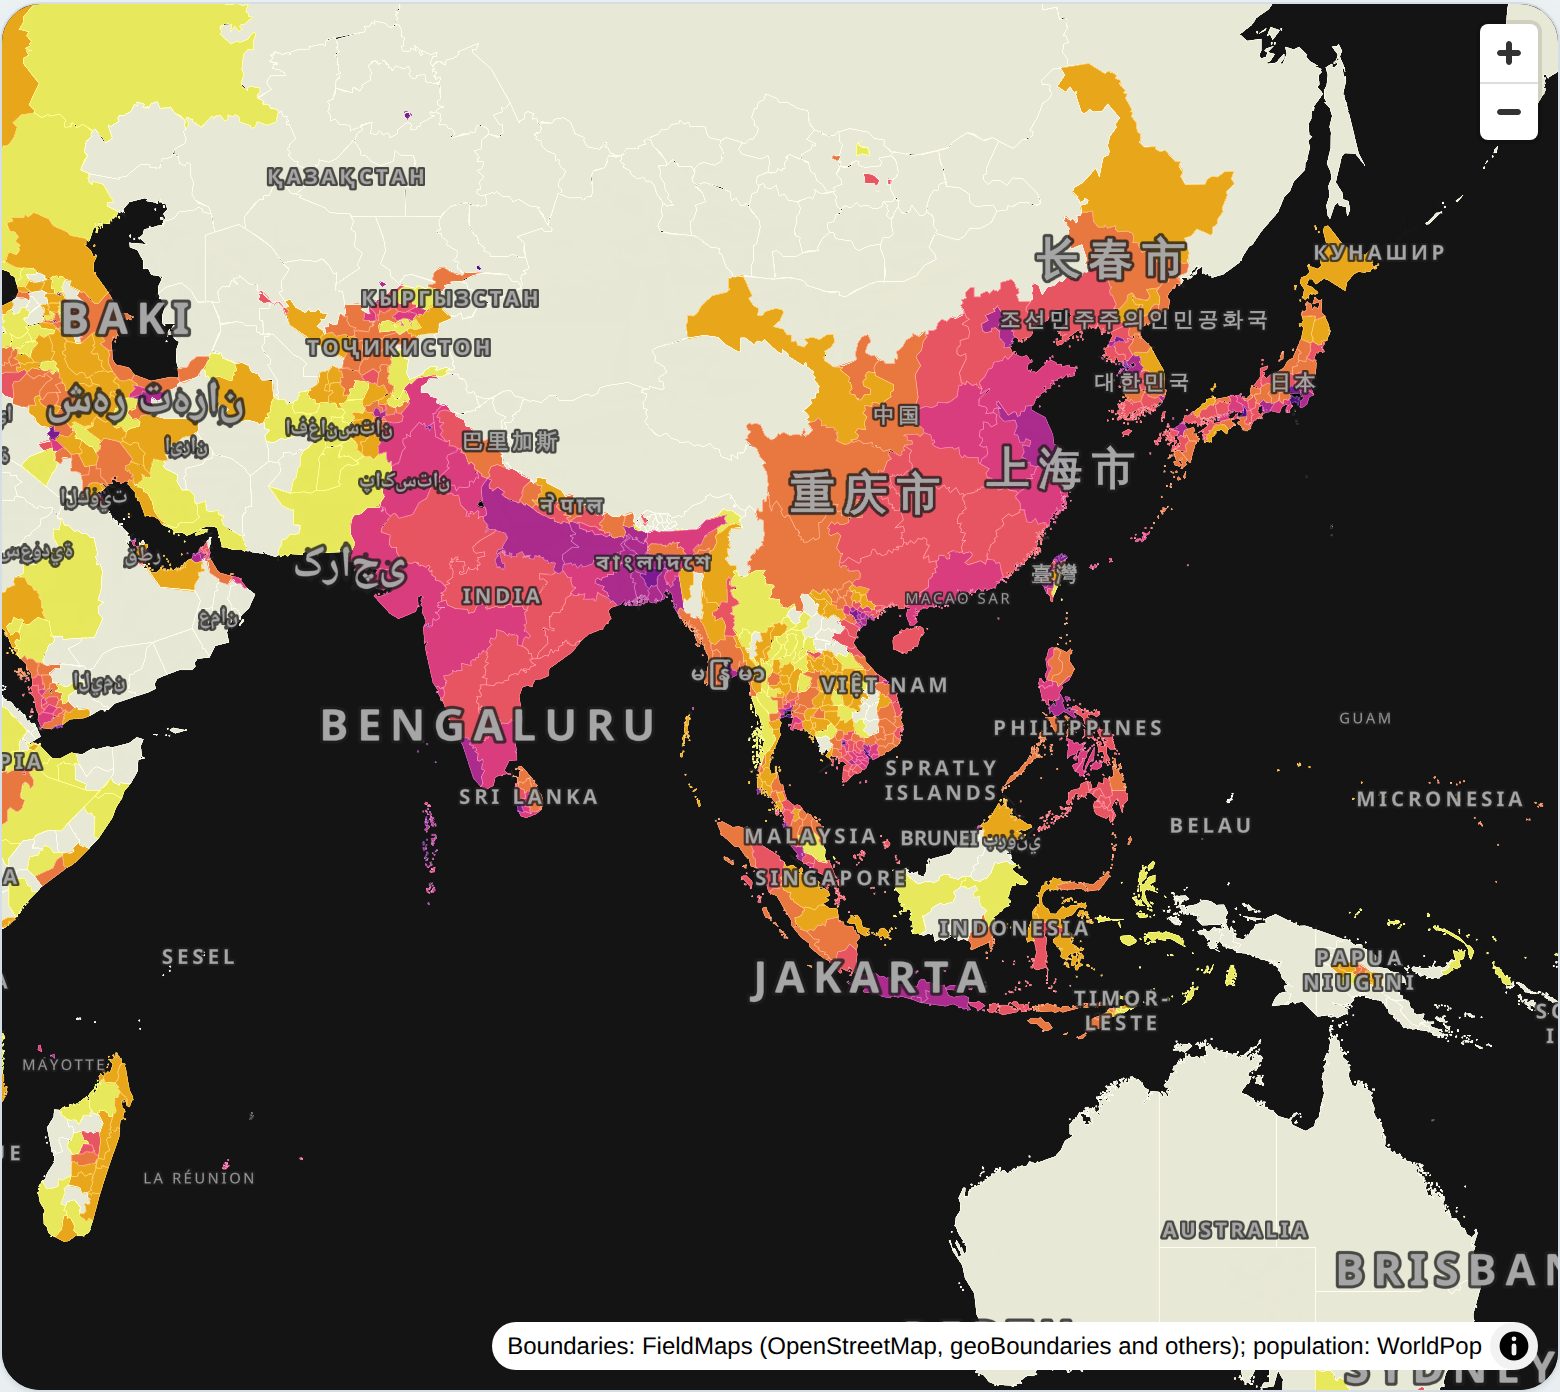
Population density for nearly 4 million administrative areas, from countries down to the fourth level, with the age structure, trend and ethnolinguistic make-up of any area you pick.
What it shows
Every area is coloured by its 2026 population density, from WorldPop estimates totalling 8.26 billion people. Classes double from 25 to 6,400, or switch to UN Degree of Urbanisation thresholds, quantiles, natural breaks, or breaks computed from whatever is on screen. The map moves to finer levels as you zoom.
Click an area, or draw a lasso around many, to see its population, area, density, age pyramid and 2015–2030 trend. For a lasso of up to 2,000 areas, the combined pyramid is summed in the browser.
For countries down to the third level, each area has a printable profile: the peoples and languages whose mapped extents overlap it, a diversity measure, and population estimates for each people computed three ways, so the methods can be compared side by side.
How it was built
- Slim the source. DuckDB reads only the needed columns of each level's GeoParquet over HTTPS, measures areas on the ellipsoid, and geoparquet-io writes best-practice GeoParquet (bbox column, Hilbert order, ZSTD).
- Tile without dropping. tylertoo builds a zoom pyramid as GeoParquet and exports PMTiles. Its defaults thin features the way you would for roads, which left whole regions blank, so thinning is off and the build fails unless every area is present at full detail and no zoom loses more than 1% of the population.
- Host as files. The 3.2 GB of tiles sit on Cloudflare R2 and MapLibre reads them by byte range. There is no tile server.
- Read age bands live. Age structure is not in the tiles. The page reads one area's row from the source GeoParquet through a small Worker that only allows bounded range requests, using the files' country ordering to touch a single row group.
- Profile the areas. Overlaps between areas and ethnolinguistic polygons are estimated from 8.8 million sample points; population estimates are spread over the WorldPop 2026 1 km grid inside each extent. Both run in minutes on a laptop and are published as small GeoParquet tables the profile page reads directly.
Exact polygon intersection was the first approach and ran for hours on large multipart polygons. Sampling and rasterizing gave the same lists in under two minutes.
Query it in place
The area tables are GeoParquet on R2, sorted by area code, so a reader fetches only the row groups it needs.
SELECT name, adm1_nm, pop, round(pop / area_km2) AS per_km2
FROM 'https://data.leeberryman.com/hge/profiles/2026-10-22/areas_adm2.parquet'
WHERE code LIKE 'MYS-%'
ORDER BY per_km2 DESC
LIMIT 10;